OpenTelemetry Observability
Keptn makes any Kubernetes deployment observable.
In other words, it creates a distributed, end-to-end trace
of what Kubernetes does in the context of a Deployment.
To do this,
Keptn introduces the concept of an application,
which is an abstraction that connects multiple
Workloads that logically belong together,
even if they use different deployment strategies.
This means that:
- You can readily see why a deployment takes so long or why it fails, even when using multiple deployment strategies.
- Keptn can capture DORA metrics and expose them as OpenTelemetry metrics
The observability data is an amalgamation of the following:
- DORA metrics are collected out of the box when Keptn is enabled
- OpenTelemetry runs traces that show everything that happens in the Kubernetes cluster
- Custom Keptn metrics that you can use to monitor information from all the data providers configured in your cluster
All this information can be displayed with dashboard tools such as Grafana.
For an introduction to using OpenTelemetry with Keptn metrics, see the Keptn Observability getting started guide.
Requirements for OpenTelemetry
To access OpenTelemetry metrics with Keptn, you must have the following on your cluster:
- An OpenTelemetry collector. See OpenTelemetry Collector for more information.
-
A Prometheus Operator. See Prometheus Operator Setup.
- The Prometheus Operator must have the required permissions
to watch resources of your Keptn namespace
(default is
keptn-system). See Setup for Monitoring other Namespaces.
- The Prometheus Operator must have the required permissions
to watch resources of your Keptn namespace
(default is
-
To install Prometheus into the
monitoringnamespace using the example configuration included with Keptn, use the following command sequence. You can modify these commands to define a different configuration:Note You must clone the
lifecycle-toolkitrepository andcdinto the correct directory (examples/support/observability) before running the following commands. -
If you want a dashboard for reviewing metrics and traces:
- Install Grafana or the visualization tool of your choice, following the instructions in Grafana Setup.
-
Install Jaeger or a similar tool for traces following the instructions in Jaeger Setup.
-
Follow the instructions in the Grafana README file to configure the Grafana dashboard(s) for Keptn.
Metrics can also be retrieved without a dashboard. See Accessing Metrics via the Kubernetes Custom Metrics API
Integrate OpenTelemetry into Keptn
To integrate OpenTelemetry into Keptn:
- Apply
basic annotations
for the
Deploymentresource(s) to integrate Keptn into your Kubernetes cluster. - To expose OpenTelemetry metrics,
define a KeptnConfig resource
that has the
spec.OTelCollectorUrlfield populated with the URL of the OpenTelemetry collector.
The
otel-collector.yaml
is the OpenTelemetry manifest file for the PodtatoHead example,
located in the config directory.
To deploy and configure the OpenTelemetry collector
using this manifest, the command is:
Use the following command to confirm that the pod
for the otel-collector deployment is up and running:
$ kubectl get pods -lapp=opentelemetry \
    -n keptn-system

NAME                              READY   STATUS    RESTARTS      AGE
otel-collector-6fc4cc84d6-7hnvp   1/1     Running   0             92m
If you want to extend the OTel Collector configuration
to send your telemetry data to other Observability platform,
you can edit the Collector ConfigMap with the following command:
When the otel-collector pod is up and running,
restart the lifecycle-operator
so they can pick up the new configuration:
Keptn begins to collect OpenTelemetry metrics
as soon as the Deployment resource
has the basic annotations to integrate Keptn in the cluster.
Access Keptn metrics as OpenTelemetry metrics
Keptn metrics can be exposed as OpenTelemetry (OTel) metrics
via port 9999 of the Keptn metrics-operator.
To access the metrics, use the following command:
You can access the metrics from your browser at: http://localhost:9999
Define timeout for workload observability
There are situations when the deployment of the application fails due to
various reasons (e.g. container image not found).
By default Keptn observes the state of the Kubernetes workloads
for 5 minutes.
After this timeout is exceeded, the deployment phase (from Keptn
viewpoint) is considered as Failed and Keptn does not proceed
with post-deployment phases (tasks, evaluations or promotion phase).
This timeout can be modified for the cluster by changing the value
of the observabilityTimeout field in the
KeptnConfig
resource.
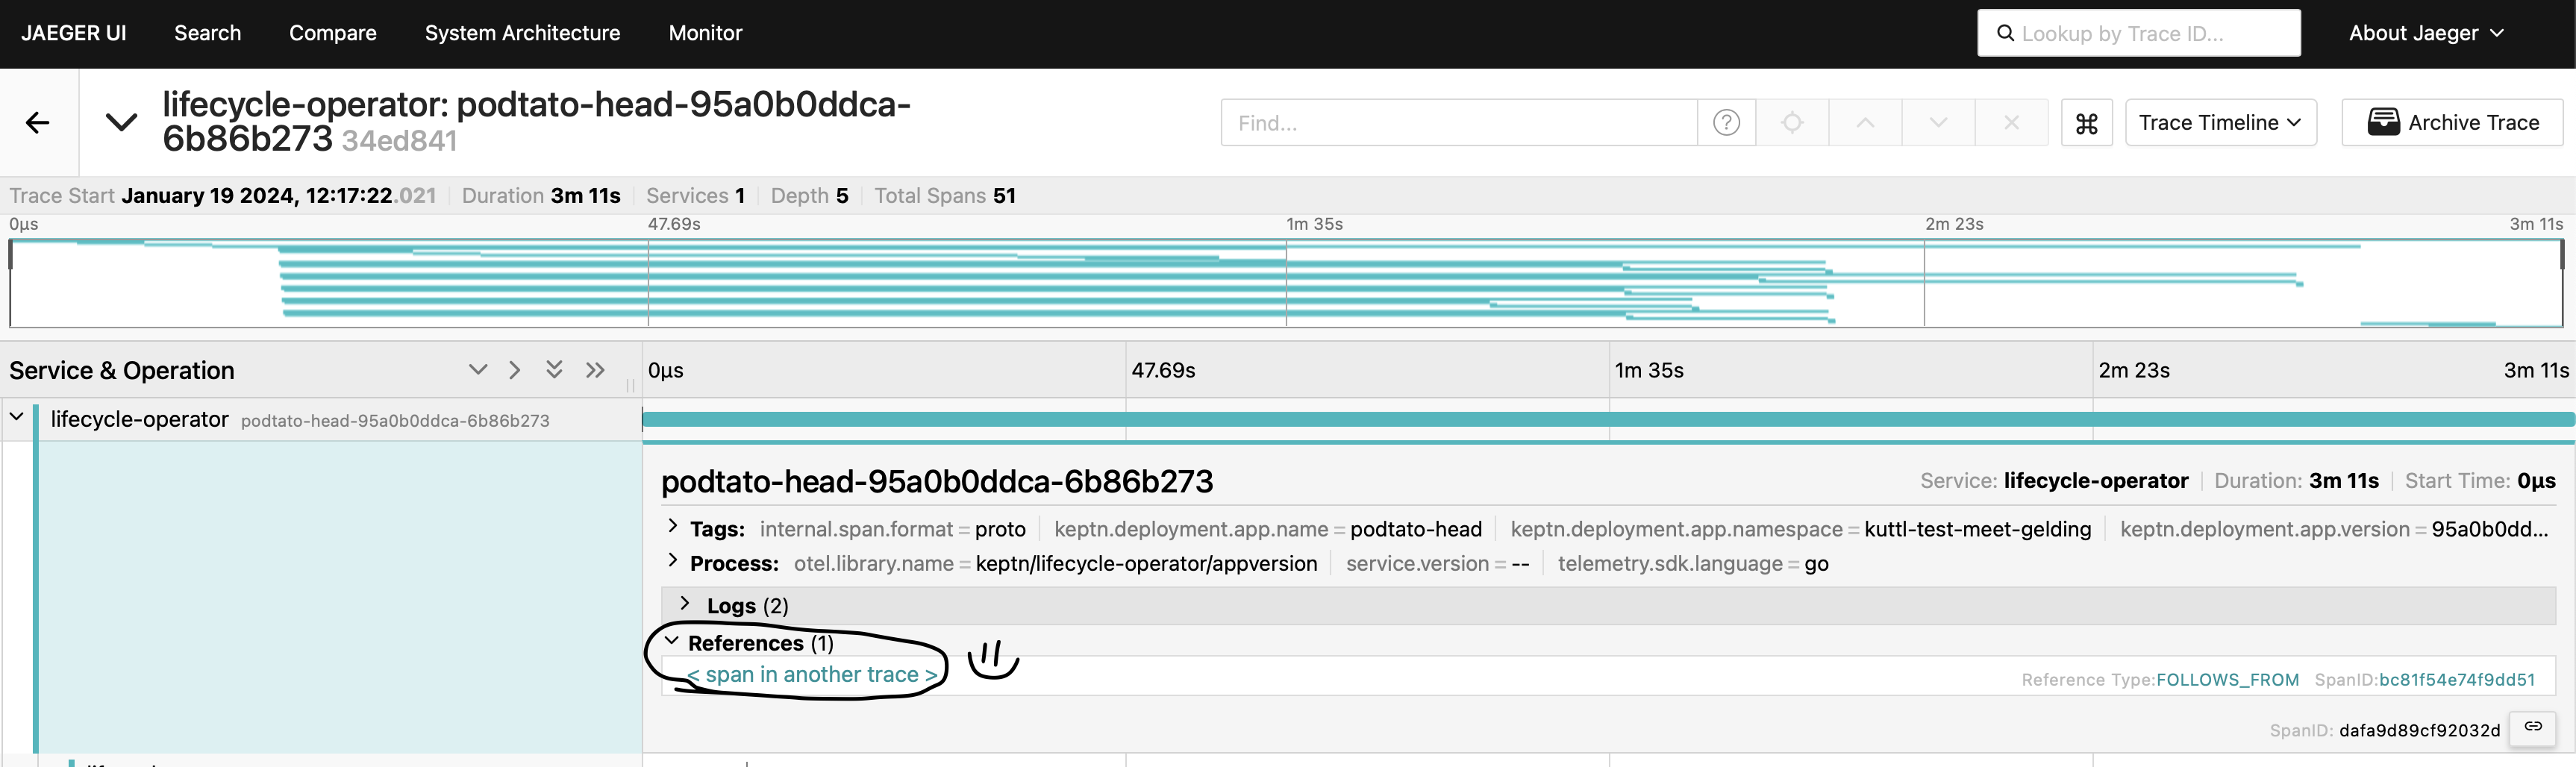
Advanced tracing configurations in Keptn: Linking traces
In Keptn you can connect multiple traces, for instance to connect deployments of the same application through different stages. To create connections between the traces of versions of your application, you can enrich the KeptnAppContext resource with OpenTelemetry span links. You can retrieve the span link from the JSON representation of the trace in Jaeger, where it has the following structure:
Use this value to populate the spanLinks field
of your KeptnAppContext resource
to connect traces of different versions of the application.
apiVersion: lifecycle.keptn.sh/v1
kind: KeptnAppContext
metadata:
  name: keptndemoapp
  namespace: keptndemo
spec:
  metadata:
    commit-id: "1234"
    author: "myUser"
  spanLinks:
    - "00-c088f5c586bab8649159ccc39a9862f7-f862289833f1fba3-01"
Note The span link used above is just an example. You need to replace it with the traceID and spanID that you retrieve from the
KeptnAppVersionresource you want to link.
To store this new information in the traces, you need to increment the version
of your application and apply theKeptnAppContext.
Keptn will re-deploy your application and Jaeger should show a link to the previous trace in the references section.