Keptn Observability
Keptn provides sophisticated observability features that enhance your existing cloud-native deployment environment. These features are useful whether or not you use a GitOps strategy.
The following is an imperative walkthrough.
Prerequisites
- Docker
- kubectl
- Helm
- A Kubernetes cluster >= 1.27 (we recommend Kubernetes kind)
(
kind create cluster)
Objectives
- Install Keptn on your cluster
- Annotate a namespace and deployment to enable Keptn
- Install Grafana and Observability tooling to view DORA metrics and OpenTelemetry traces
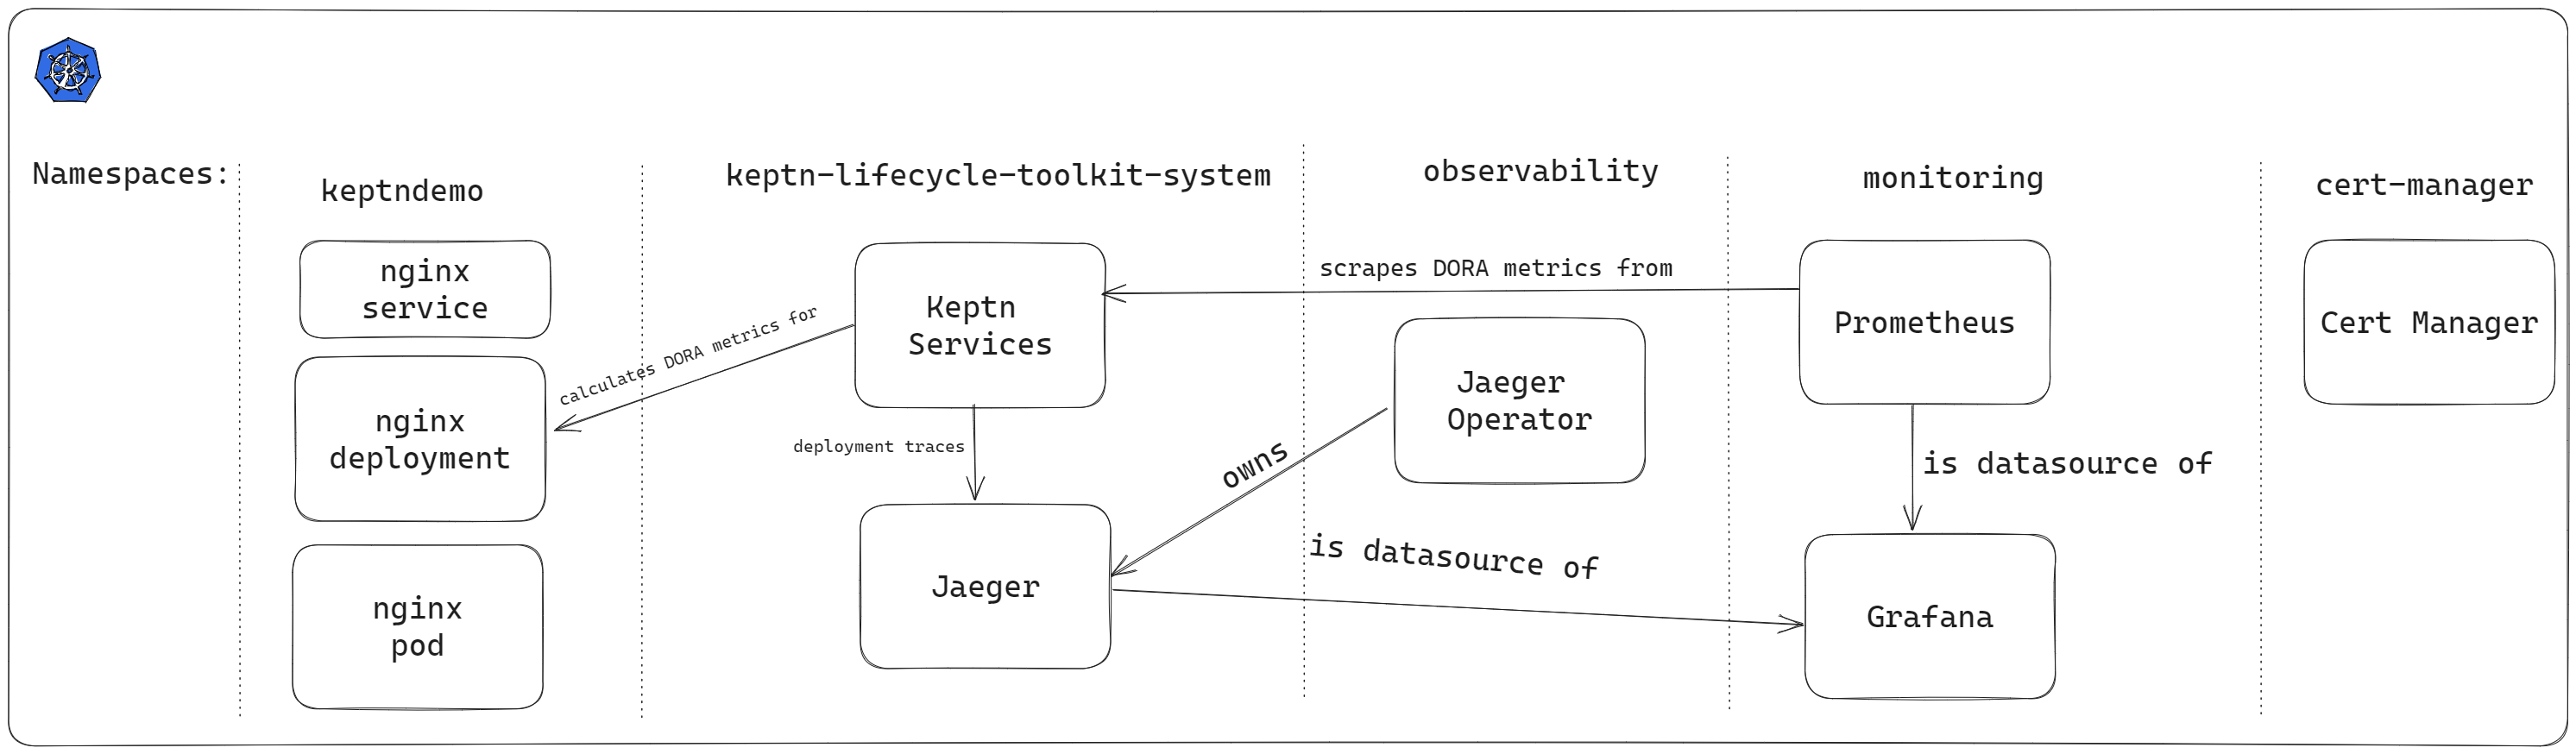
System Overview
By the end of this page, here is what will be built. The system will be built in stages.
The Basics: A Deployment, Keptn and DORA Metrics
To begin our exploration of the Keptn observability features, we will:
- Deploy a simple application called
keptndemo.
Keptn will monitor the deployment and generate:
- An OpenTelemetry trace per deployment
- DORA metrics
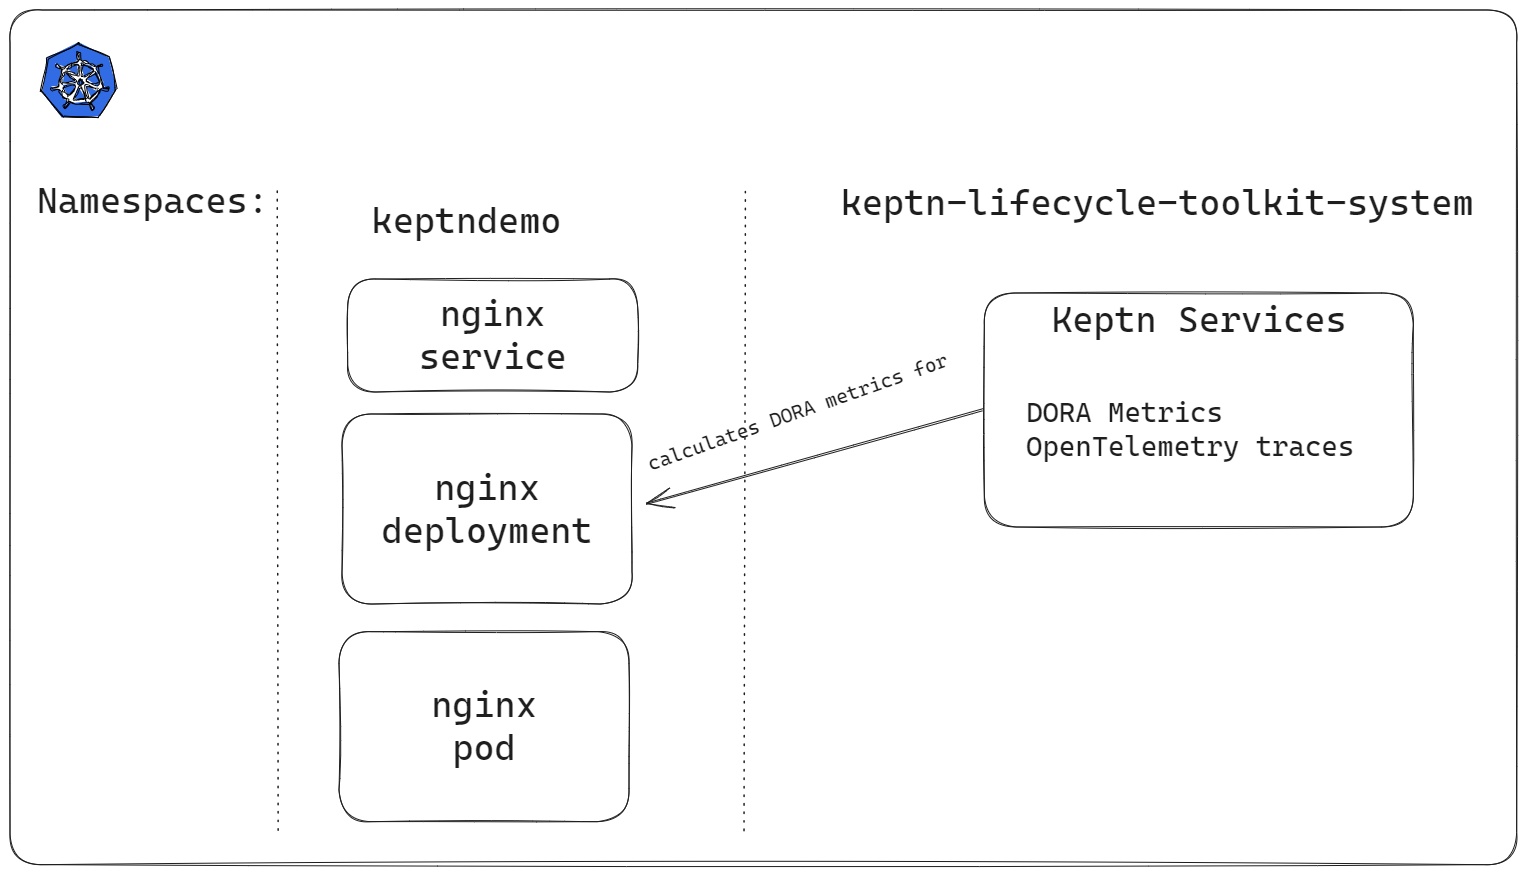
Notice though that the metrics and traces have nowhere to go. That will be fixed in a subsequent step.
Step 1: Install Keptn
Install Keptn using Helm:
helm repo add keptn https://charts.lifecycle.keptn.sh
helm repo update
helm upgrade --install keptn keptn/keptn -n keptn-system --create-namespace --wait
Keptn will need to know where to send OpenTelemetry traces. Of course, Jaeger is not yet installed so traces have nowhere to go (yet), but creating this configuration now means the system is preconfigured.
Save this file as keptnconfig.yaml.
It doesn't matter where this file is located on your local machine:
---
apiVersion: options.keptn.sh/v1alpha1
kind: KeptnConfig
metadata:
  name: keptnconfig-sample
  namespace: keptn-system
spec:
  OTelCollectorUrl: 'jaeger-collector.keptn-system.svc.cluster.local:4317'
  keptnAppCreationRequestTimeoutSeconds: 30
  observabilityTimeout: 5m
Apply the file and wait for Keptn to pick up the new configuration:
Keptn reacts immediately to a configuration change. although the speed depends on the Kubernetes API server signaling updates and can be influenced by network latency.
Step 2: Create Namespace for Demo Application
Save this file as namespace.yaml.
The annotation means that Keptn is active for workloads in this namespace.
apiVersion: v1
kind: Namespace
metadata:
  name: keptndemo
  annotations:
    keptn.sh/lifecycle-toolkit: enabled
Create the namespace:
Step 3: Deploy Demo Application
It is time to deploy the demo application.
Save this manifest as app.yaml:
apiVersion: apps/v1
kind: Deployment
metadata:
  name: nginx-deployment
  namespace: keptndemo
  labels:
    app.kubernetes.io/name: nginx
spec:
  replicas: 1
  selector:
    matchLabels:
      app.kubernetes.io/name: nginx
  template:
    metadata:
      labels:
        app.kubernetes.io/part-of: keptndemoapp
        app.kubernetes.io/name: nginx
        app.kubernetes.io/version: 0.0.1
    spec:
      containers:
      - name: nginx
        image: nginx:1.14.2
        ports:
        - containerPort: 80
---
apiVersion: apps/v1
kind: Service
apiVersion: v1
kind: Service
metadata:
  name: nginx
  namespace: keptndemo
spec:
  selector:
    app.kubernetes.io/name: nginx
  ports:
    - protocol: TCP
      port: 8080
      targetPort: 80
Now apply it:
Keptn looks for these 3 labels:
app.kubernetes.io/part-ofapp.kubernetes.io/nameapp.kubernetes.io/version
These are Kubernetes recommended labels but if you want to use different labels, you can swap them for these Keptn specific labels:
keptn.sh/appinstead ofapp.kubernetes.io/part-ofkeptn.sh/workloadinstead ofapp.kubernetes.io/namekeptn.sh/versioninstead ofapp.kubernetes.io/version
Step 4: Explore Keptn
Keptn is now aware of your deployments and is generating DORA statistics about them.
Keptn has created a resource called a KeptnApp to track your application.
The name of which is based on the part-of label.
It may take up to 30 seconds to create the KeptnApp so run the following command until you see the keptnappdemo CR.
Expected output:
Keptn also creates a new application version every time you increment the version label.
The PHASE will change as the deployment progresses.
A successful deployment is shown as PHASE=Completed
Expected output:
Keptn can run tasks and SLO (Service Level Objective) evaluations before and after deployment.
You haven't configured this yet, but you can see the full lifecycle for a keptnappversion by running:
Keptn applications are a collection of workloads.
By default, Keptn will build a KeptnApp resource based on the labels you provide.
In the example above, the KeptnApp called keptndemoapp contains one KeptnWorkload
(based on the app.kubernetes.io/name label):
Step 5: View your application
Port-forward to expose your app on http://localhost:8080:
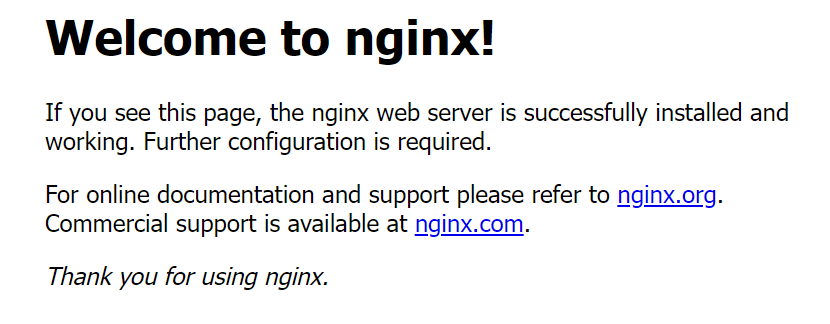
Open a browser window and go to http://localhost:8080
You should see the "Welcome to nginx" page.
Step 6: View DORA Metrics
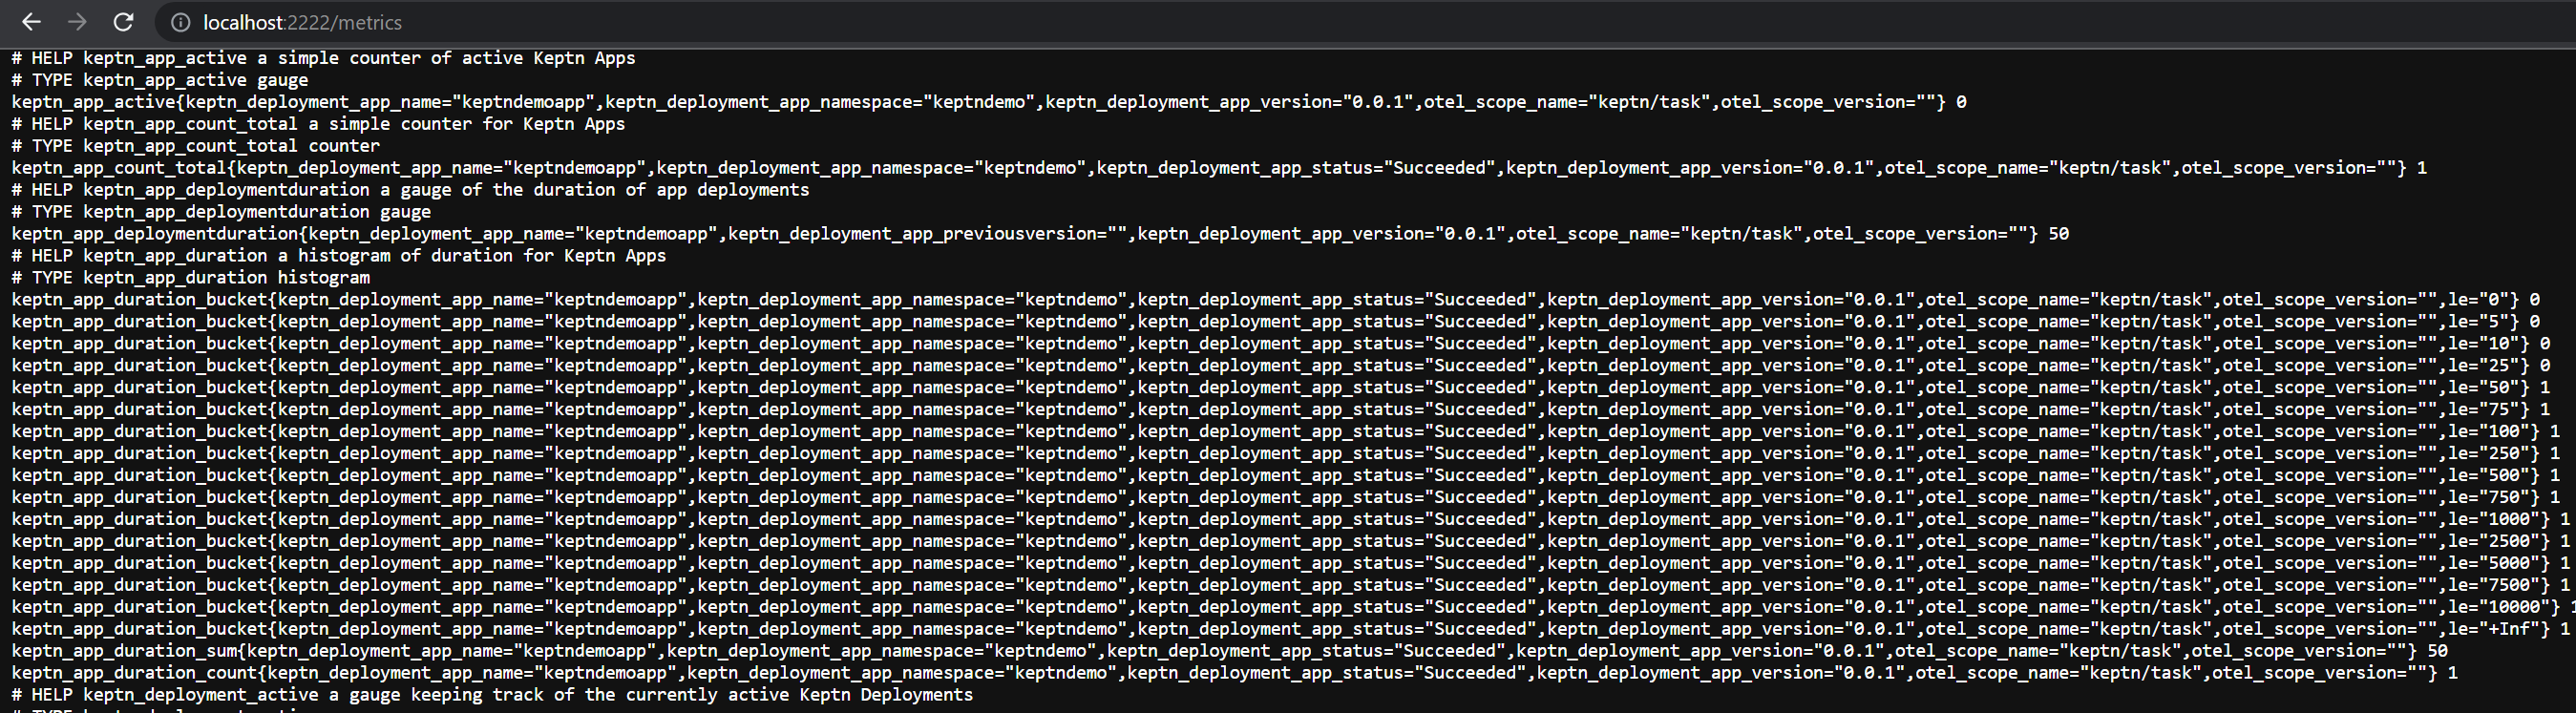
Keptn is generating DORA metrics and OpenTelemetry traces for your deployments.
These metrics are exposed via the Keptn lifecycle operator /metrics endpoint on port 2222.
To see these raw metrics, port forward to the lifecycle operator metrics service:
SERVICE=$(kubectl get svc -l control-plane=lifecycle-operator -A -ojsonpath="{.items[0].metadata.name}")
kubectl -n keptn-system port-forward svc/$SERVICE 2222
Note that this command will (and should) continue to run in your terminal windows. Open a new terminal window to continue.
- Access metrics in Prometheus format on
http://localhost:2222/metrics - Look for metrics starting with
keptn_
Keptn emits various metrics about the state of your system. These metrics can then be visualised in Grafana.
For example:
keptn_app_activetracks the number of applications that Keptn manageskeptn_deployment_activetracks the currently live number of deployments occurring. Expect this metric to be0when everything is currently deployed. It will occasionally rise tonduring deployments and then fall back to0when deployments are completed.
There are many other Keptn metrics.
Step 7: Make DORA metrics more user friendly
It is much more user-friendly to provide dashboards for metrics, logs and traces. So let's install new Observability components to help us:
- Cert manager: Jaeger requires cert-manager
- Jaeger: Store and view DORA deployment traces
- OpenTelemetry collector: Scrape metrics from the above DORA metrics endpoint
& forward to Prometheus.
In this guide, we will use the OTel collector that comes bundled with the Jaeger
allInOneimage. - Prometheus: Store DORA metrics
- Grafana (and some prebuilt dashboards): Visualise the data
Step 8: Install Cert Manager
Jaeger requires Cert Manager, so install it now:
kubectl apply -f https://github.com/cert-manager/cert-manager/releases/download/v1.12.2/cert-manager.crds.yaml
helm repo add jetstack https://charts.jetstack.io
helm repo update
helm install cert-manager --namespace cert-manager --version v1.12.2 jetstack/cert-manager --create-namespace --wait
Step 9: Install Jaeger
Save this file as jaeger.yaml (it can be saved anywhere on your computer):
Install Jaeger to store and visualise the deployment traces generated by Keptn:
kubectl create namespace observability
kubectl apply -f https://github.com/jaegertracing/jaeger-operator/releases/download/v1.46.0/jaeger-operator.yaml -n observability
kubectl wait --for=condition=available deployment/jaeger-operator -n observability --timeout=300s
kubectl apply -f jaeger.yaml -n keptn-system
kubectl wait --for=condition=available deployment/jaeger -n keptn-system --timeout=300s
Port-forward to access Jaeger:
Jaeger is available on http://localhost:16686
Step 10: Install Grafana dashboards
Create some Keptn Grafana dashboards that will be available when Grafana is installed and started:
kubectl create ns monitoring
kubectl apply -f https://raw.githubusercontent.com/keptn/lifecycle-toolkit/keptn-v2.5.0/examples/support/observability/config/prometheus/grafana-config.yaml
kubectl apply -f https://raw.githubusercontent.com/keptn/lifecycle-toolkit/keptn-v2.5.0/examples/support/observability/config/prometheus/grafana-dashboard-keptn-applications.yaml
kubectl apply -f https://raw.githubusercontent.com/keptn/lifecycle-toolkit/keptn-v2.5.0/examples/support/observability/config/prometheus/grafana-dashboard-keptn-overview.yaml
kubectl apply -f https://raw.githubusercontent.com/keptn/lifecycle-toolkit/keptn-v2.5.0/examples/support/observability/config/prometheus/grafana-dashboard-keptn-workloads.yaml
Install Grafana datasources
This file will configure Grafana to look at the Jaeger service and the Prometheus service on the cluster.
Save this file as datasources.yaml:
apiVersion: v1
kind: Secret
type: Opaque
metadata:
labels:
grafana_datasource: "1"
name: grafana-datasources
namespace: monitoring
stringData:
datasources.yaml: |-
{
"apiVersion": 1,
"datasources": [
{
"access": "proxy",
"editable": false,
"name": "prometheus",
"orgId": 1,
"type": "prometheus",
"url": "http://observability-stack-kube-p-prometheus.monitoring.svc:9090",
"version": 1
},
{
"orgId":1,
"name":"Jaeger",
"type":"jaeger",
"typeName":"Jaeger",
"typeLogoUrl":"public/app/plugins/datasource/jaeger/img/jaeger_logo.svg",
"access":"proxy",
"url":"http://jaeger-query.keptn-system.svc.cluster.local:16686",
"user":"",
"database":"",
"basicAuth":false,
"isDefault":false,
"jsonData":{"spanBar":{"type":"None"}},
"readOnly":false
}
]
}
Now apply it:
Step 11: Install kube prometheus stack
This will install:
- Prometheus
- Prometheus Configuration
- Grafana & default dashboards
Save this file as values.yaml:
grafana:
adminPassword: admin
sidecar:
datasources:
defaultDatasourceEnabled: false
prometheus:
prometheusSpec:
additionalScrapeConfigs:
- job_name: "scrape_klt"
scrape_interval: 5s
static_configs:
- targets: ['lifecycle-operator-metrics-service.keptn-system.svc.cluster.local:2222']
helm repo add prometheus-community https://prometheus-community.github.io/helm-charts
helm repo update
helm upgrade --install observability-stack prometheus-community/kube-prometheus-stack --version 48.1.1 --namespace monitoring --values=values.yaml --wait
Step 12: Access Grafana
- Grafana username:
admin - Grafana password:
admin
View the Keptn dashboards at: http://localhost/dashboards
Remember that Jaeger and Grafana weren't installed during the first deployment so expect the dashboards to look a little empty.
Step 13: Deploy v0.0.2 and populate Grafana
By triggering a new deployment, Keptn will track this deployment and the Grafana dashboards will actually have data.
Modify your app.yaml and change the app.kubernetes.io/version from 0.0.1 to 0.0.2
(or keptn.sh/version if you used the Keptn specific labels earlier).
Apply your update:
After about 30 seconds you should now see two keptnappversions:
Expected output:
NAME                      APPNAME        VERSION   PHASE
keptndemoapp-0.0.1-***    keptndemoapp   0.0.1     Completed
keptndemoapp-0.0.2-*** keptndemoapp 0.0.2 AppDeploy
Wait until the PHASE of keptndemoapp-0.0.2 is Completed.
This signals that the deployment was successful and the pod is running.
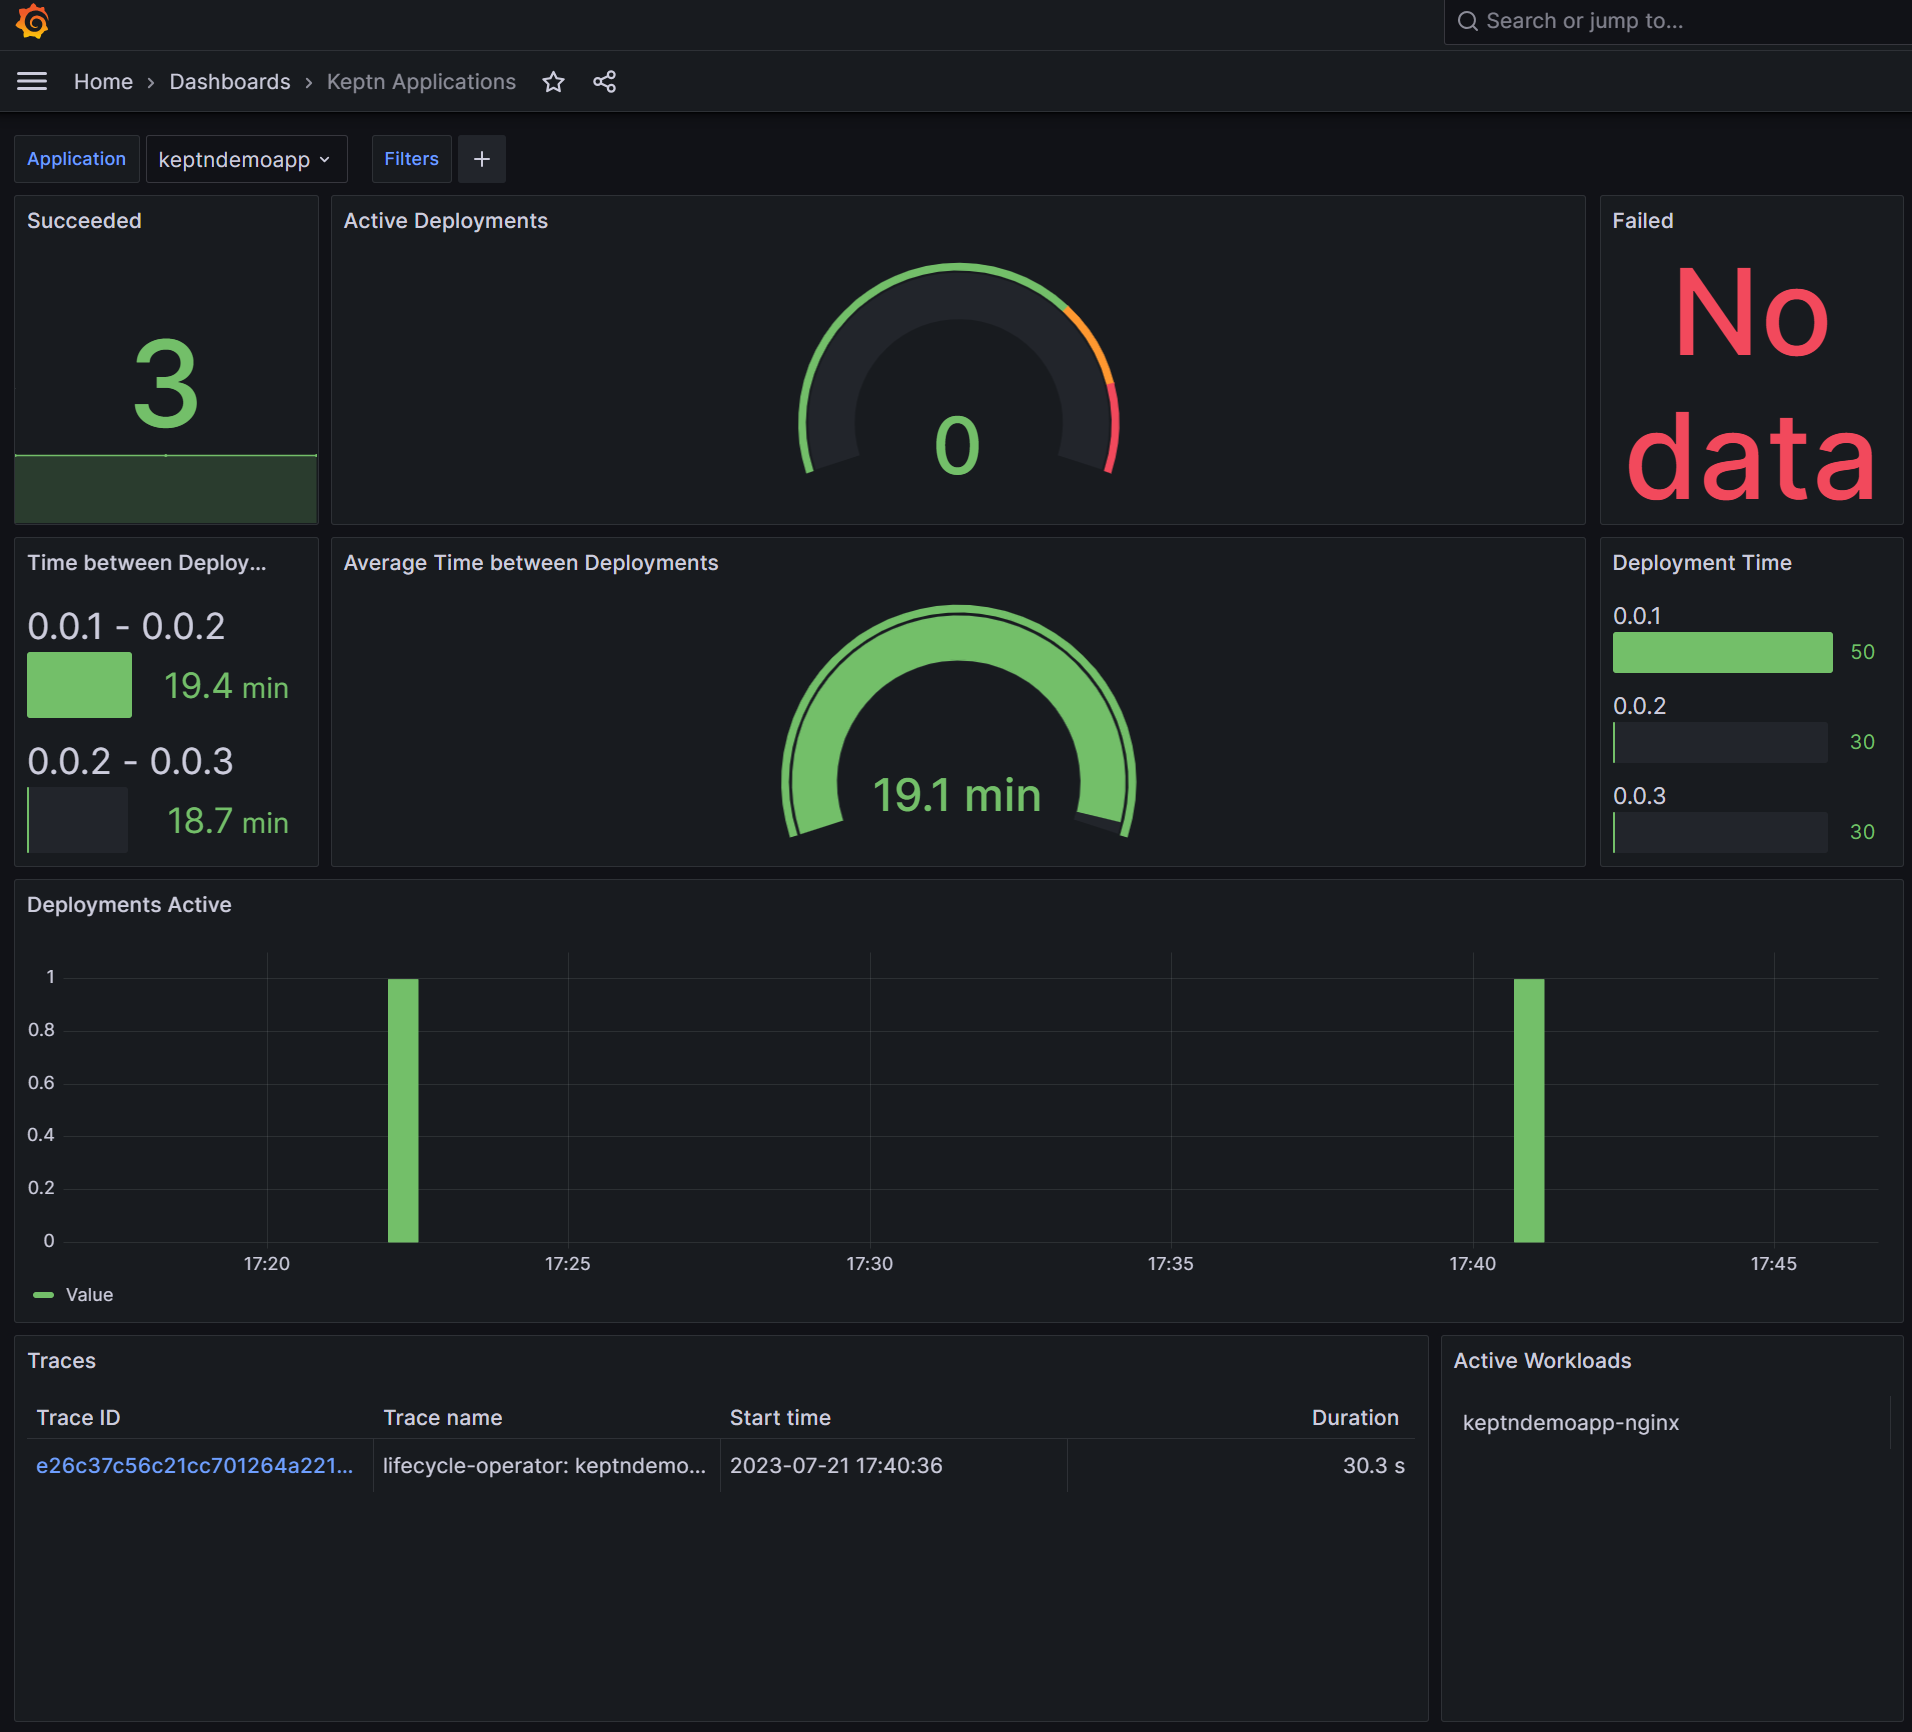
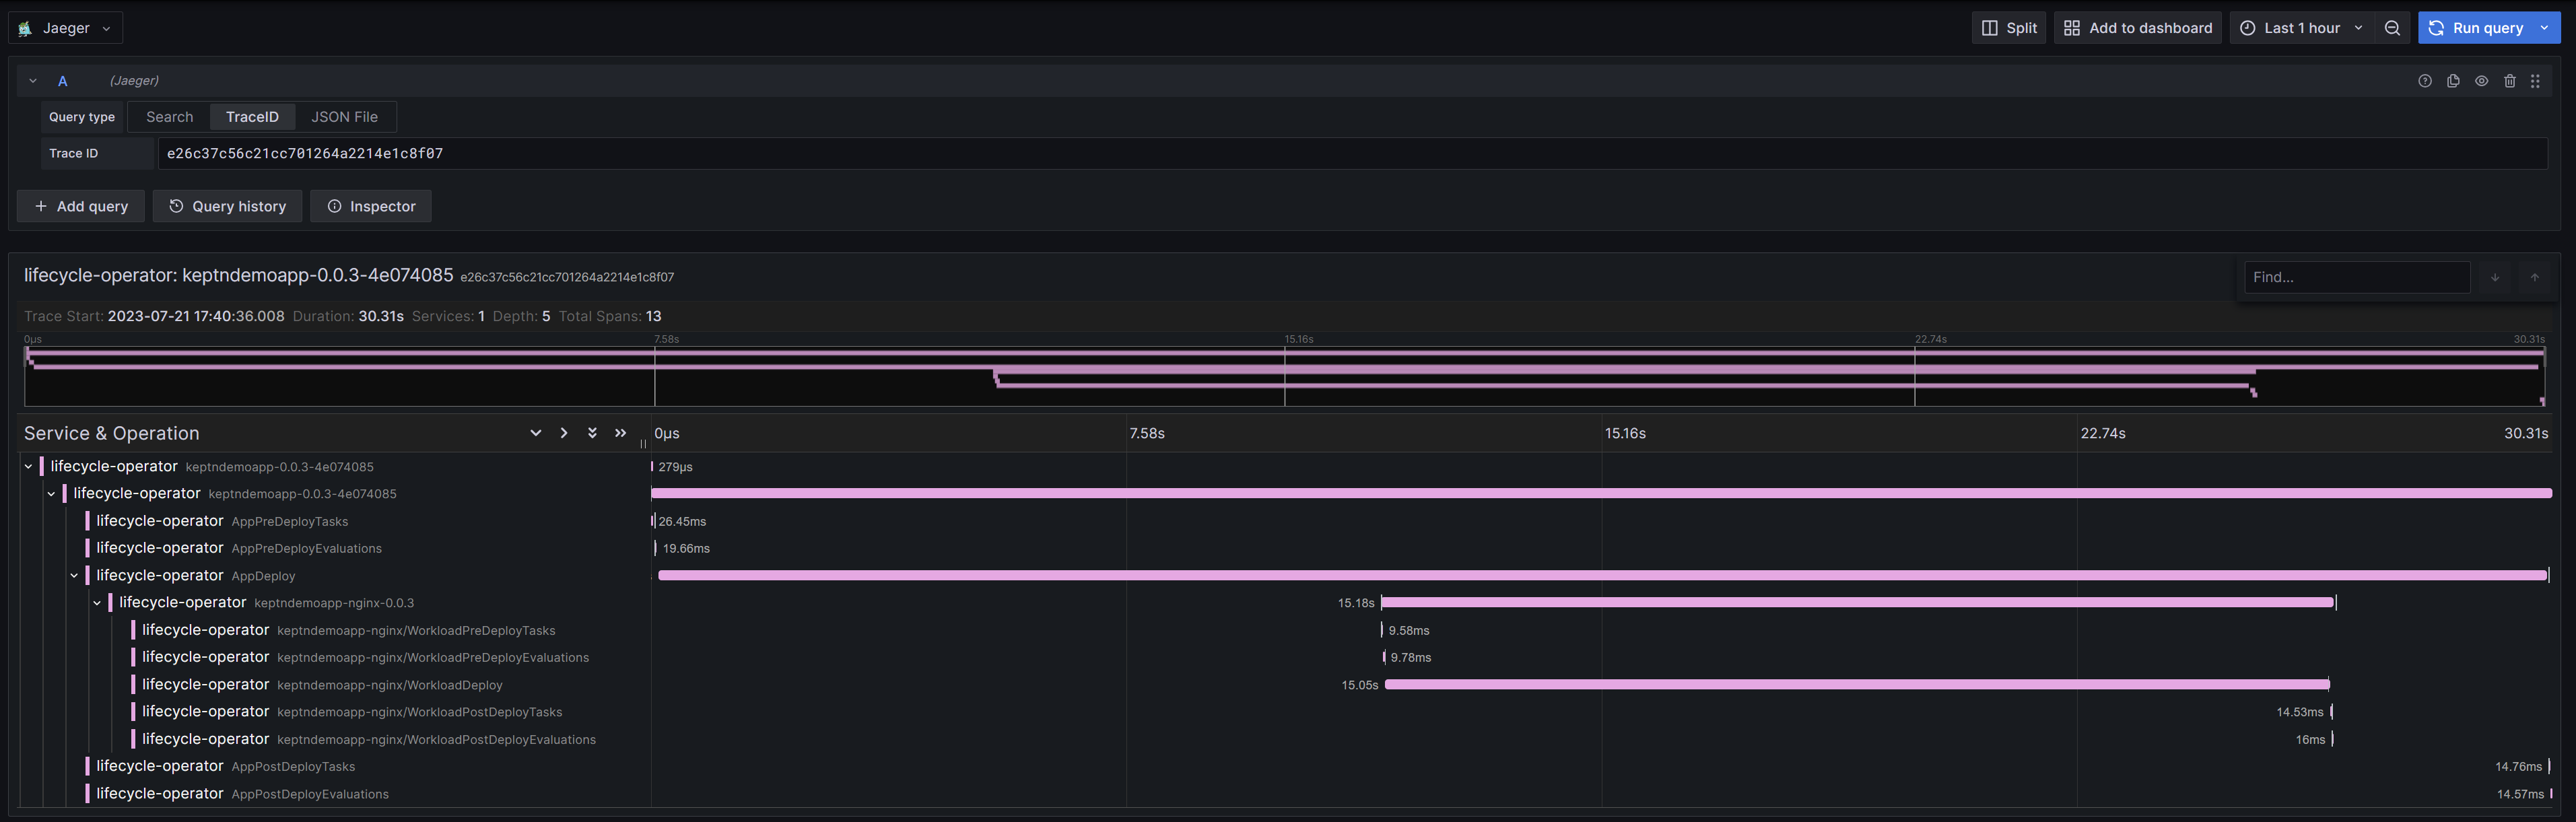
View the Keptn Applications Dashboard and you should see the DORA metrics and an OpenTelemetry trace:
What's next?
Keptn can run pre and post deployment tasks and SLO evaluations automatically.
Continue the Keptn learning journey by adding deployment tasks.