Keptn v1 reached EOL December 22, 2023. For more information see https://bit.ly/keptn
Home / Keptn v1 Docs / Concepts / Quality Gates
Quality Gates
When developing a software product, you eventually need to deliver a new version of your service in a production environment. To conduct this in a controlled manner and without impacting end-user experience, the quality of the new service has to be ensured in an automated way.
💡 A quality gate allows conducting a deployment/release validation by ensuring that defined quality criteria are met.
Keptn quality gates provide a declarative way to define quality criteria of your service. Keptn collects, evaluates, and scores those quality criteria to decide if a new release is allowed to be promoted to the next stage or if it must be held back.
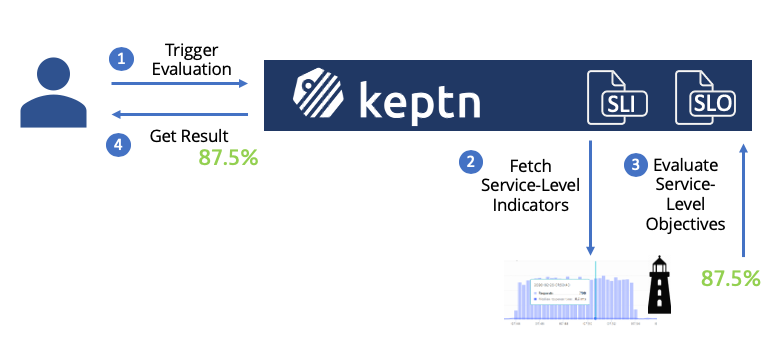
Keptn Quality Gate Process
Keptn quality gates are based on the concepts of Service-Level Indicators (SLIs) and Service-Level Objectives (SLOs). Using these, you can declaratively describe the desired quality objective for your applications and services.
- The process of evaluating a quality gate can be triggered using the Keptn Bridge, the Keptn CLI or the Keptn API.
- Once triggered, Keptn fetches the SLIs. from a data provider like Prometheus, Dynatrace, or Datadog.
- Keptn evaluates the SLI against the SLOs that are defined for the application or service.
- After evaluation and scoring, Keptn returns the result that can be either processed in an automated way by an existing CD pipeline or by the user to manually decide on the next steps (e.g., promotion to production or pushing it back to the developer for needed improvements).
What is a Service-Level Indicator (SLI)?
A service-level indicator is a “carefully defined quantitative measure of some aspect of the level of service that is provided” (as defined in the Site-Reliability Engineering Book).
An example of an SLI is the response time (also named request latency), which is the indicator of how long it takes for a request to respond with an answer. Other prominent SLIs are error rate (or failure rate), and throughput. Keptn defines all SLIs in a dedicated sli.yaml file to make SLIs reusable within several quality gates.
By default, SLIs are defined at the project level but they can also be defined for a specific stage or service within a stage. See the SLI reference page for details.
What is a Service-Level Objective (SLO)?
A service-level objective is “a target value or range of values for a service level that is measured by an SLI.” (as defined in the Site-Reliability Engineering Book).
An example of an SLO can define that a specific request must return results within 100 milliseconds. Keptn quality gates can comprise several SLOs that are all evaluated and scored, based even on different weights for each SLO to consider different importance of each SLO. Keptn defines SLOs in a dedicated slo.yaml file.
Quality gate result on the Keptn Bridge
💡 A quality gate answers one question: Does my service meet all defined quality criteria?
Keptn quality gates help you answer this question by representing quality gate results on the Keptn Bridge like this:
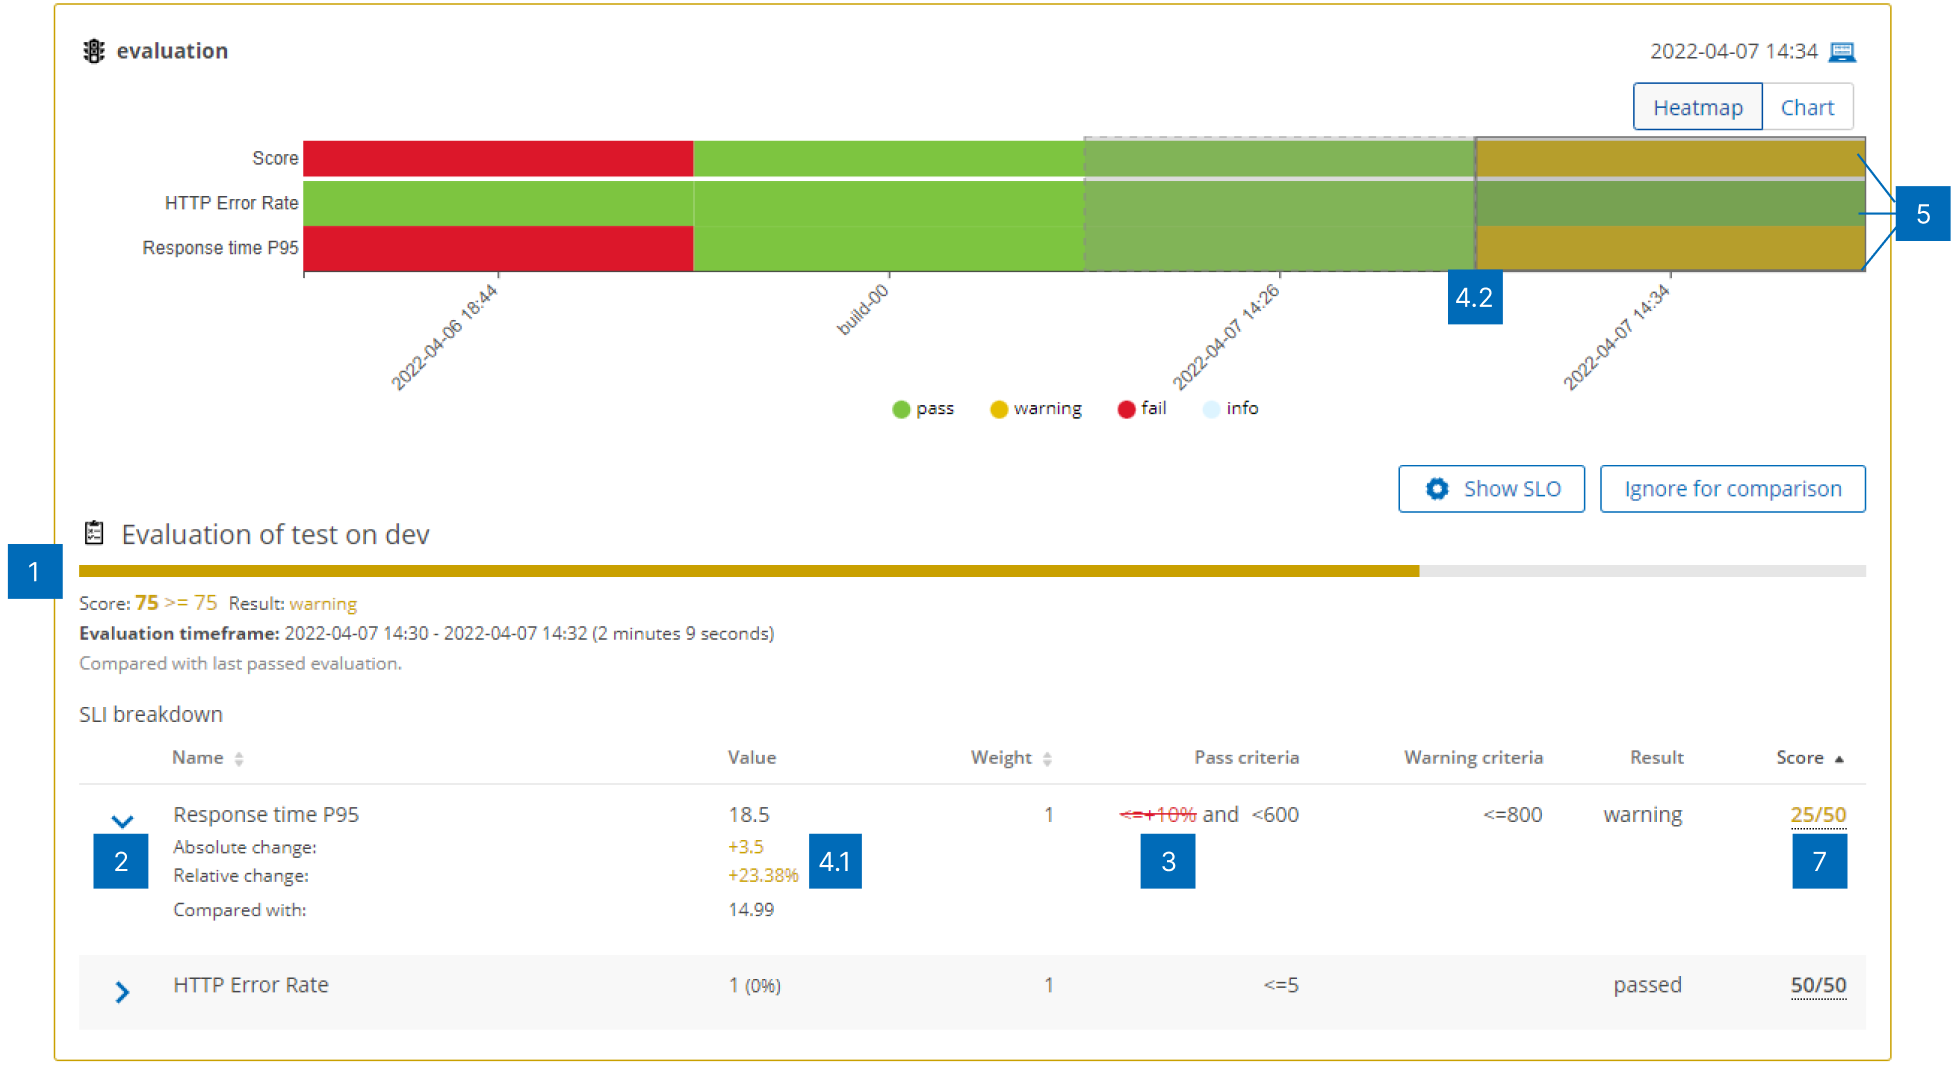
This visualization in the Keptn Bridge allows you to answer the following questions:
- First and most important, does the service meet all defined quality criteria?
- 1️⃣ Here, the overall result is a warning as shown by the orange bar and with the total score between 50 (fail) and 90 (pass) points.
- Which criteria did not meet its objective?
- 2️⃣ The response time P95 was measured with 18.5 ms. This value is higher than the pass criteria allows, which is more than 10% compared to the previous value.
- What does the <=10% mean?
- 3️⃣ This is a relative comparison for which the quality gate result of a previous evaluation is taken into account. In fact, the last passed comparison is taken as a reference value.
- How did this quality result perform compared to others?
- 4️⃣ The answer to this question can be found in the SLI breakdown (4.1) and the Heatmap and Chart (4.2) on the top.
- The Heatmap highlights the currently selected quality gate result with a gray and solid border. The quality gate result that is taken into comparison is highlighted by the dashed border.
- 5️⃣ The total score of a quality gate result is depicted by the cell on the top.
- The individual criteria are represented by a separate cell in the column.
- How is the score calculated?
- The score is a number between 0 and 100 (percentage). The sum of the weights of all indicator results is seen as 100%.
- The maximum reachable score of an indicator result depends on its contribution to the total weight. If the sum of all weights is 5 and the indicator result has a weight of 2, the maximum reachable score would be 40 (=2/5*100).
- If an indicator result is failed, its score is set to 0.
- 7️⃣ If an indicator result is warning, its score is halved.