Keptn v1 reached EOL December 22, 2023. For more information see https://bit.ly/keptn
This documentation is for an older Keptn release. Please consider the newest one when working with the latest Keptn.
Home / Keptn v1 Docs / Release 0.9.2 / Monitoring / Dynatrace / Install
Install
Deploy Dynatrace Operator on Kubernetes
Bring your Dynatrace SaaS or Dynatrace-managed tenant. If you do not have a Dynatrace tenant, sign up for a free trial or a developer account.
To setup Dynatrace monitoring on your Kubernetes cluster, please follow the official Dynatrace documentation on Deploy Dynatrace Operator.
Notes:
-
By default, most Kubernetes clusters will only offer a self-signed certificate. In such cases, please select Skip SSL Security Check when deploying the Dynatrace Operator.
-
When deploying the Dynatrace Operator to a cluster running on a Container-Optimized OS (COS), which includes GKE, Anthos, CaaS and PKS environments, please select the Enable volume storage option.
-
To verify that the Dynatrace Operator is working properly, check the status of the pods, e.g. using kubectl:
kubectl get pods -n dynatraceA status of
Runningindicates that the Dynatrace Operator is functioning normally, whileErrororCrashLoopBackOffare signs of a problem. -
To ensure that existing workloads are being monitored, please restart the pods. For example, to restart the pods in the
sockshop-devnamespace:kubectl delete pods --all --namespace=sockshop-dev
Install Dynatrace Keptn integration
1. Gather Dynatrace credentials
To function correctly, the dynatrace-service requires access to a Dynatrace tenant, specified through DT_TENANT and DT_API_TOKEN:
-
The
DT_TENANThas to be set according to the appropriate pattern:- Dynatrace SaaS tenant:
{your-environment-id}.live.dynatrace.com - Dynatrace-managed tenant:
{your-domain}/e/{your-environment-id}
- Dynatrace SaaS tenant:
-
To create a Dynatrace API token
DT_API_TOKEN, log in to your Dynatrace tenant and go to Settings > Integration > Dynatrace API. In this settings page, create a new API token with the following permissions:- Read metrics
- Ingest metrics
- Read logs
- Read entities
- Read problems
- Access problem and event feed, metrics, and topology
- Read configuration
- Write configuration
- Capture request data
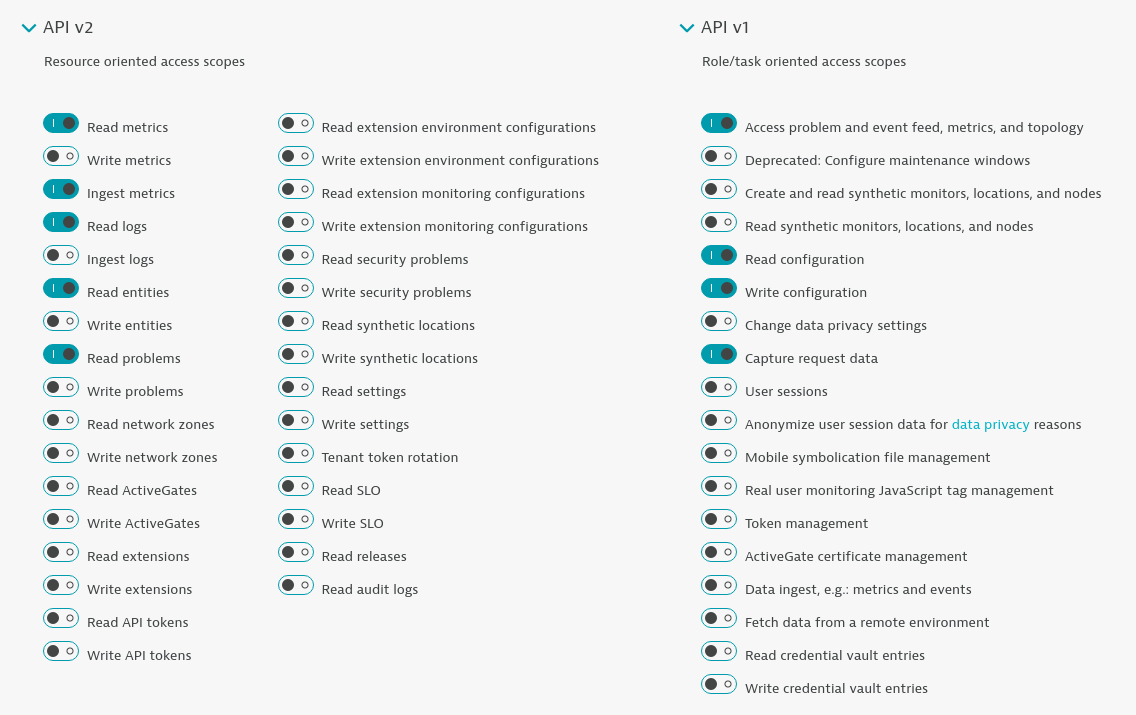
Dynatrace API Token -
If running on a Unix/Linux based system, you can use environment variables to simplify the process of creating the credentials secret. Alternatively, It is also fine to just replace the variables with values in the
keptncommand in the following section.DT_API_TOKEN=<DT_API_TOKEN> DT_TENANT=<DT_TENANT>
2. Create a secret with credentials
-
Create a secret (named
dynatraceby default) containing the credentials for the Dynatrace Tenant (DT_API_TOKENandDT_TENANT).keptn create secret dynatrace --from-literal="DT_TENANT=$DT_TENANT" --from-literal="DT_API_TOKEN=$DT_API_TOKEN"
3. Gather Keptn credentials
The dynatrace-service also requires access to the Keptn API, provided through the KEPTN_API_URL, KEPTN_API_TOKEN and optionally KEPTN_BRIDGE_URL:
-
To get the values for
KEPTN_API_URL(also known asKEPTN_ENDPOINT), please see Authenticate Keptn CLI. -
By default the
KEPTN_API_TOKENis read from thekeptn-api-tokensecret (i.e. the secret from the control-plane) and does not need to be set during installation. -
If you would like to use backlinks from your Dynatrace tenant to the Keptn Bridge, provide the service with
KEPTN_BRIDGE_URL. For further details about this value, please see Authenticate Keptn Bridge. -
Similarly to the Dynatrace tenant credentials, if running on a Unix/Linux based system, you can use environment variables to set the values of the credentials. It is also fine to just replace the variables with values in the
helmcommand in the following section.KEPTN_API_URL=<KEPTN_API_URL> KEPTN_BRIDGE_URL=<KEPTN_BRIDGE_URL> # optional
4. Deploy the Dynatrace Keptn integration
The Dynatrace integration into Keptn is handled by the dynatrace-service.
-
Specify the version of the dynatrace-service you want to deploy. Please see the compatibility matrix of the dynatrace-service to pick the version that works with your Keptn.
VERSION=<VERSION> # e.g.: VERSION=0.17.0 -
To install the dynatrace-service, execute:
helm upgrade --install dynatrace-service -n keptn \ https://github.com/keptn-contrib/dynatrace-service/releases/download/$VERSION/dynatrace-service-$VERSION.tgz \ --set dynatraceService.config.keptnApiUrl=$KEPTN_ENDPOINT \ --set dynatraceService.config.keptnBridgeUrl=$KEPTN_BRIDGE_URL \ --set dynatraceService.config.generateTaggingRules=true \ --set dynatraceService.config.generateProblemNotifications=true \ --set dynatraceService.config.generateManagementZones=true \ --set dynatraceService.config.generateDashboards=true \ --set dynatraceService.config.generateMetricEvents=true -
This installs the
dynatrace-servicein thekeptnnamespace, which you can verify using:kubectl -n keptn get deployment dynatrace-service -o wide kubectl -n keptn get pods -l run=dynatrace-service
Verify Dynatrace configuration
When you execute the keptn configure monitoring command, the dynatrace-service will configure the Dynatrace tenant by creating tagging rules, a problem notification, an alerting profile as well as a project-specific dashboard and management zone.
-
Tagging rules: When you navigate to Settings > Tags > Automatically applied tags in your Dynatrace tenant, you will find following tagging rules:
- keptn_deployment
- keptn_project
- keptn_service
- keptn_stage
This means that Dynatrace will automatically apply tags to your onboarded services.
-
Problem notification: A problem notification has been set up to inform Keptn of any problems with your services to allow auto-remediation. You can check the problem notification by navigating to Settings > Integration > Problem notifications and you will find a keptn remediation problem notification.
-
Alerting profile: An alerting profile with all problems set to 0 minutes (immediate) is created. You can review this profile by navigating to Settings > Alerting > Alerting profiles.
-
Dashboard and Management zone: When creating a new Keptn project or executing the keptn configure monitoring command for a particular project (see Note 1/), a dashboard and management zone will be generated reflecting the environment as specified in the shipyard.
Note: If you already have created a project using Keptn and would like to enable Dynatrace monitoring for that project, please execute the following command:
keptn configure monitoring dynatrace --project=PROJECTNAME