Keptn v1 reached EOL December 22, 2023. For more information see https://bit.ly/keptn
Home / Keptn v1 Docs / Release 0.16.x / Monitoring / Prometheus / Install
Install
In order to evaluate the quality gates and allow self-healing in production, we must set up monitoring to get the needed data and fetch the values for the SLIs that are referenced in an SLO configuration.
Prerequisites
-
Keptn project with at least one deployed service with a
/metricsendpoint for Prometheus. -
Prometheus Monitoring installed in
monitoringnamespacekubectl create namespace monitoring helm repo add prometheus-community https://prometheus-community.github.io/helm-charts helm install prometheus prometheus-community/prometheus --namespace monitoring -
The prometheus-service (which will be deployed later) needs access to the Prometheus instance. By default it uses the Prometheus instance running on the same Kubernetes cluster as Keptn control-plane, in the
monitoringnamespace. If you are using another, external Prometheus instance, create a secret containing the user, password, and url. The secret must have the following format (please note the double-space indentation):
    user: username
    password: ***
    url: http://prometheus-service.monitoring.svc.cluster.local:8080
If this information is stored in a file, e.g. prometheus-creds.yaml, the secret can be created with the following command.
Please note that there is a naming convention for the secret because this can be configured per project.
Thus, the secret must have the name prometheus-credentials-<project>.
Do not forget to replace the <project> placeholder with the name of your project:
kubectl create secret -n keptn generic prometheus-credentials-<project> --from-file=prometheus-credentials=./prometheus-creds.yaml
For more details, see the README for prometheus-service.
Set up Prometheus Keptn integration
Execute the following steps to install prometheus-service
- Install prometheus-service in
keptnnamespace
helm upgrade --install -n keptn prometheus-service https://github.com/keptn-contrib/prometheus-service/releases/download/0.8.0/prometheus-service-0.8.0.tgz --reuse-values
- Install Role and RoleBinding to permit the prometheus-service for performing operations in the Prometheus installed namespace:
kubectl -n monitoring apply -f https://raw.githubusercontent.com/keptn-contrib/prometheus-service/0.8.0/deploy/role.yaml
- Execute the following command which performs:
- an update of the Prometheus configuration to add scrape jobs for the service in the specified Keptn project
- the defintion of alert rules based on the SLO configuration of that service in the various stages. Please note: If no SLO is available in a stage, no alert rule will be created. Besides, the alert will be firing after monitoring a violation of the SLO for more than 10 minutes.
keptn configure monitoring prometheus --project=sockshop --service=carts
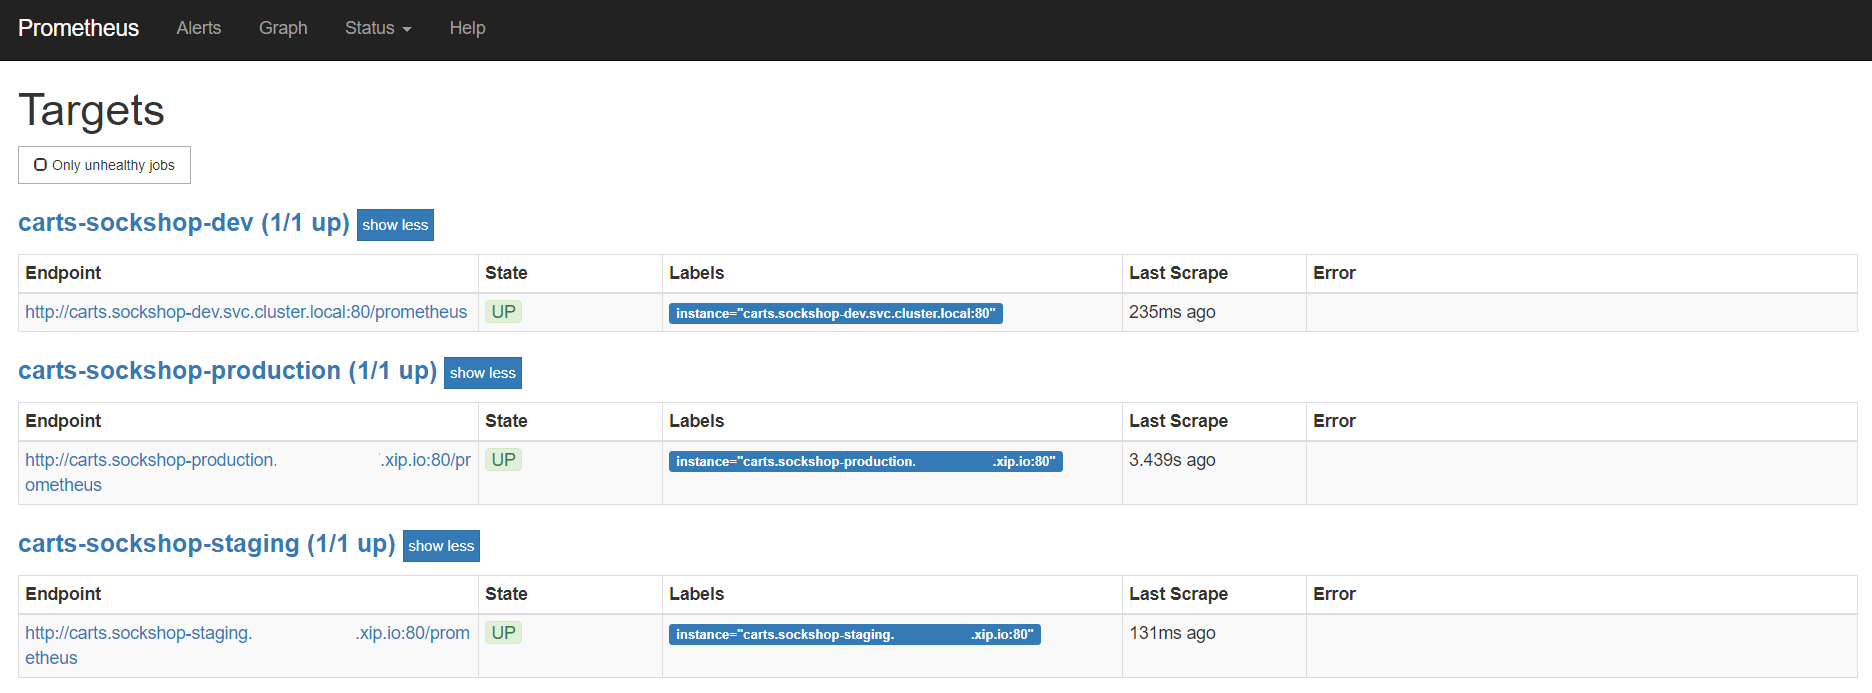
Verify Prometheus setup in your cluster
- To verify that the Prometheus scrape jobs are correctly set up, you can access Prometheus by enabling port-forwarding for the prometheus-server:
kubectl -n monitoring port-forward svc/prometheus-server 8080:80
Prometheus is then available on localhost:8080/targets where you can see the targets for the service.
Configure custom Prometheus SLIs
To tell the prometheus-service how to acquire the values of an SLI, the correct query needs to be configured. This is done by adding an SLI configuration to a project, stage, or service using the add-resource command. The resource identifier must be prometheus/sli.yaml.
- In the below example, the SLI configuration as specified in the
sli-config-prometheus.yamlfile is added to the servicecartsin stagehardeningfrom projectsockshop.
keptn add-resource --project=sockshop --stage=hardening --service=carts --resource=sli-config-prometheus.yaml --resourceUri=prometheus/sli.yaml
Note: The add-resource command can be used to store a configuration on project-, stage-, or service-level. If you store SLI configurations on different levels, see Add SLI configuration to a Service, Stage, or Project to learn which configuration overrides the others based on an example.
Example for custom SLI:
Please take a look at this snippet, which implements a concrete SLI configuration to learn more about the structure of a SLI file. It is possible to use placeholders such as $PROJECT (e.g., sockshop), $SERVICE (e.g., carts), $STAGE (e.g., staging) and $DURATION_SECONDS in the queries.
---
spec_version: '1.0'
indicators:
  response_time_p50: histogram_quantile(0.5, sum by(le) (rate(http_response_time_milliseconds_bucket{job="$SERVICE-$PROJECT-$STAGE"}[$DURATION_SECONDS])))
  response_time_p90: histogram_quantile(0.9, sum by(le) (rate(http_response_time_milliseconds_bucket{job="$SERVICE-$PROJECT-$STAGE"}[$DURATION_SECONDS])))
  response_time_p95: histogram_quantile(0.95, sum by(le) (rate(http_response_time_milliseconds_bucket{job="$SERVICE-$PROJECT-$STAGE"}[$DURATION_SECONDS])))