Keptn v1 reached EOL December 22, 2023. For more information see https://bit.ly/keptn
This documentation is for an older Keptn release. Please consider the newest one when working with the latest Keptn.
Home / Keptn v1 Docs / Release 0.13.x / Monitoring / Prometheus / Install
Install
In order to evaluate the quality gates and allow self-healing in production, we have to set up monitoring to get the needed data and fetch the values for the SLIs that are referenced in a SLO configuration.
Prerequisites
-
Keptn project with at least one deployed service with a
/metricsendpoint for Prometheus. -
Prometheus Monitoring installed in
monitoringnamespacekubectl create namespace monitoring helm repo add prometheus-community https://prometheus-community.github.io/helm-charts helm install prometheus prometheus-community/prometheus --namespace monitoring -
The prometheus-service (which will be deployed later) needs access to the Prometheus instance. By default it uses the Prometheus instance running in the cluster. If another Prometheus instance shall be used, create a secret containing the user, password, and url. The secret must have the following format (please note the double-space indentation):
    user: username
    password: ***
    url: http://prometheus-service.monitoring.svc.cluster.local:8080
If this information is stored in a file, e.g. prometheus-creds.yaml, the secret can be created with the following command. Please note that there is a naming convention for the secret because this can be configured per project. Thus, the secret has to have the name prometheus-credentials-<project>. Do not forget to replace the <project> placeholder with the name of your project:
kubectl create secret -n keptn generic prometheus-credentials-<project> --from-file=prometheus-credentials=./prometheus-creds.yaml
Setup Prometheus Keptn integration
- Install prometheus-service in
keptnnamespace
helm upgrade --install -n keptn prometheus-service https://github.com/keptn-contrib/prometheus-service/releases/download/0.7.5/prometheus-service-0.7.5.tgz --reuse-values
- Install Role and RoleBinding to permit the prometheus-service for performing operations in the Prometheus installed namespace:
kubectl -n monitoring apply -f https://raw.githubusercontent.com/keptn-contrib/prometheus-service/0.7.5/deploy/role.yaml
- Execute the following command which performs:
- an update of the Prometheus configuration to add scrape jobs for the service in the specified Keptn project
- the defintion of alert rules based on the SLO configuration of that service in the various stages. Please note: If no SLO is available in a stage, no alert rule will be created. Besides, the alert will be firing after monitoring a violation of the SLO for more than 10 minutes.
keptn configure monitoring prometheus --project=sockshop --service=carts
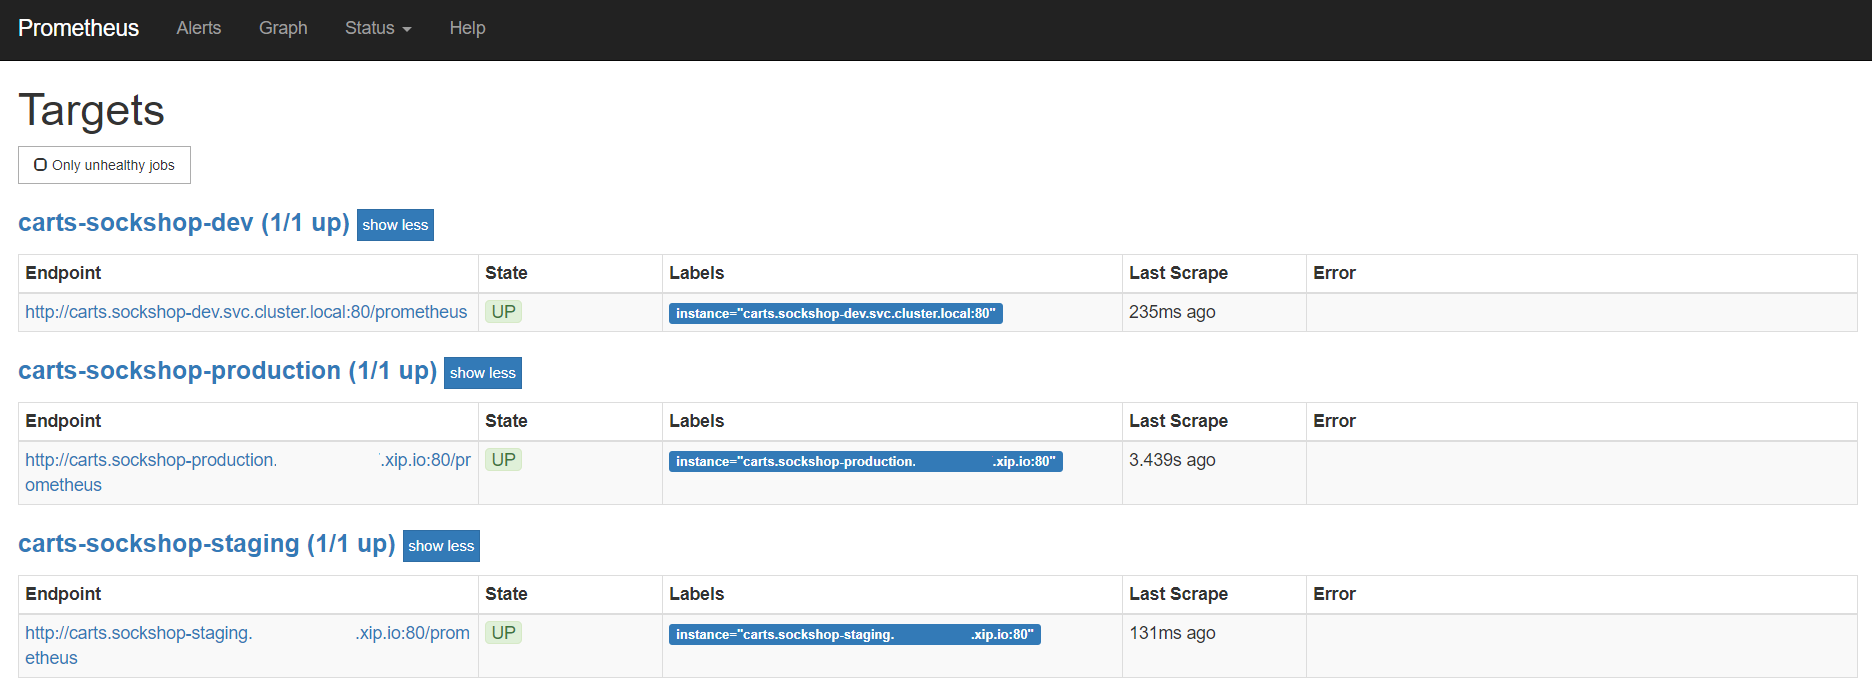
Verify Prometheus setup in your cluster
- To verify that the Prometheus scrape jobs are correctly set up, you can access Prometheus by enabling port-forwarding for the prometheus-server:
kubectl -n monitoring port-forward svc/prometheus-server 8080:80
Prometheus is then available on localhost:8080/targets where you can see the targets for the service.
Configure custom Prometheus SLIs
To tell the prometheus-service how to acquire the values of an SLI, the correct query needs to be configured. This is done by adding an SLI configuration to a project, stage, or service using the add-resource command. The resource identifier must be prometheus/sli.yaml.
- In the below example, the SLI configuration as specified in the
sli-config-prometheus.yamlfile is added to the servicecartsin stagehardeningfrom projectsockshop.
keptn add-resource --project=sockshop --stage=hardening --service=carts --resource=sli-config-prometheus.yaml --resourceUri=prometheus/sli.yaml
Note: The add-resource command can be used to store a configuration on project-, stage-, or service-level. If you store SLI configurations on different levels, see Add SLI configuration to a Service, Stage, or Project to learn which configuration overrides the others based on an example.
Example for custom SLI:
Please take a look at this snippet, which implements a concrete SLI configuration to learn more about the structure of a SLI file. It is possible to use placeholders such as $PROJECT, $SERVICE, $STAGE and $DURATION_SECONDS in the queries.
---
spec_version: '1.0'
indicators:
  response_time_p50: histogram_quantile(0.5, sum by(le) (rate(http_response_time_milliseconds_bucket{job="$SERVICE-$PROJECT-$STAGE"}[$DURATION_SECONDS])))
  response_time_p90: histogram_quantile(0.9, sum by(le) (rate(http_response_time_milliseconds_bucket{job="$SERVICE-$PROJECT-$STAGE"}[$DURATION_SECONDS])))
  response_time_p95: histogram_quantile(0.95, sum by(le) (rate(http_response_time_milliseconds_bucket{job="$SERVICE-$PROJECT-$STAGE"}[$DURATION_SECONDS])))